
There are many reasons for wanting to know what goes on beneath the surface of the skin – scientists in medicine, pharmacology, and skincare use RiverD’s dedicated in vivo Confocal Raman Spectrometers to analyse the molecular composition of the skin.
Here we introduce Confocal Raman Spectroscopy, with insight into how it’s used to tell where and how much of a substance is in the skin.
Simplifying complexity
One motivation for this series of articles is that a lot of people have the impression that one needs to be a Raman Spectroscopy expert to get the most from its powerful features.
The reality is that it doesn’t have to be that way. RiverD has put its 20 years of experience into developing the SkinTools 3 software-package for analysis of in vivo skin Raman spectra. The result is a set of powerful tools that simplify and streamline the analysis of data, so that getting meaningful and relevant study results is almost effortless.
Data volume
A Raman Spectroscopy study generates a lot of data. A typical skincare study of product penetration, consisting of 10 subjects or more, various product formulations, several measurement timepoints and perhaps multiple skin areas, will generate tens or even hundreds of thousands of spectra.

Our study management software organises your data according to subject, skin site, timepoint and product. So, when it comes to extracting the results, it’s simple to select and analyze the data and present the information at any level of detail, from individual spectra to aggregated study results. Our study management software organises your data according to subject, skin site, timepoint and product. So, when it comes to extracting the results, it’s simple to select and analyze the data and present the information at any level of detail, from individual spectra to aggregated study results.
Fingerprint library
Every Raman spectrum taken from the skin is the sum of the uniquely identifying Fingerprint spectra produced by the intrinsic skin constituents and applied chemical substances that are present.
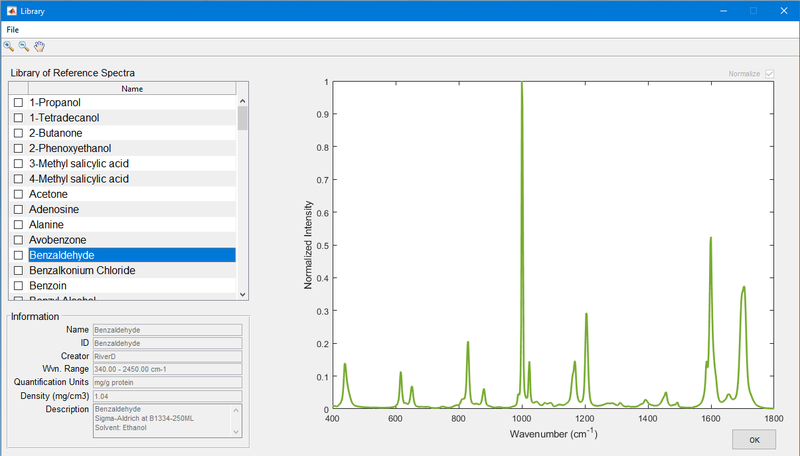
Determining how much each Fingerprint contributes to the recorded Raman spectrum is key to determining the concentration of each substance. The first thing we need to know, then, is what does the Fingerprint look like for a particular compound?

In most cases, we’ve already done the work and the Fingerprint is stored in a library which we precompiled. Compounds which naturally occur in the skin are available as a group. The library also contains many common pharmaceuticals and skincare product ingredients, and we add to this list frequently.
What if your new product is not in our library? No problem, SkinTools 3 makes it straightforward to add your new products.
Analysis
Once you’ve specified the appropriate reference Fingerprints for your study, the analysis software takes over – processing each skin spectrum to measure the applied products and intrinsic skin components.
The results are visualised per component as concentration (in mg/cm3) vs depth per timepoint and as overall mass present (in mg/cm2 of skin surface) vs timepoint. This allows product penetration performance to be assessed per formulation whilst simultaneously observing the effect on intrinsic skin components.

In the next article we’ll look at the design and performance of RiverD's Raman Spectroscope, with explanation of some of the unique features that make it specialized for use with skin in vivo. Follow us for regular content, contact us for information about how you could use Confocal Raman Spectroscopy.